Yahoo Pipes: a way to merge data from multiple providers

I remember having this conversation with Mor Naaman on the fact that crossing data from different companies was not possible or easily accessible to the public. Apparently I am now wrong as Yahoo Research Lab released a new service called Yahoo Pipes, which allow the user to merge data from different streams and manipulate the information from useful purposes.

Pipes is an interactive feed aggregator and manipulator. Using Pipes, you can create feeds that are more powerful, useful and relevant.

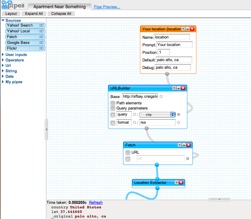
The service offer an interactive interface where it is possible to play with the data stream (like an RSS feed), manipulate the data (like applying a filter), passing the output to another service (like a web search engine), collect the output from the engine, end so on till the end: the output page. The screenshot below shows a pipe called: “apartments near something” and tries to answering the question: show me apartments for rent near a school or something. Here is how it works:

This Pipe uses craigslist and Yahoo! Local. First, we look at a search on craigslist for apartments. The search results page will show an RSS feed at the bottom which we can use as a starting point. Using the URLBuilder (in Url) we can put together a dynamic feed address that searches by whatever location people enter using the Location Input module. This module automatically translates locations between city/state and zip codes as needed. the same location entered can then be fed into Yahoo! Local using the Yahoo! Local module. We can use another text input to get something we want to find apartments near (e.g., laundromats). After putting the craigslist feed through a Location Extractor module to get the location of each listing, we can compare the two and filter out any listing that isn’t a minimum distance from our search term. Now you can get apartment searches for apartments near things you care about! You can make a copy of this Pipe right here to play with or try running the pipe.

Yahoo Pipes

This service shows an example of what the web is going to be really soon: a jungle of data streams that can be intelligently re-aggregated and manipulated for different purposes. Interfaces like that of Yahoo Pipes will help users to recycle the web for their own purposes. Also, there is a rising number of studies on how bots (software agents) can use services made for humans for the same or other purposes and what kind of difference in results we can expect.

Tags: , , , , , ,

Synchronizing logs on multiple servers

Unfortunately there is no limit to the number of things that you could not anticipate and that go wrong while designing and running an experiment with human subject. I have to admit that this bug i found in my current design could have been anticipated with some more test. However that was not the case, so I found myself trying to re-synchronize the logs of each experiments which are stored on multiple machines, with their relative a-synchronized clock.

One of the limit of using 2 eye trackers is that if you need to confront the data you must have extremely well synchronized clocks, in the order of 50 milliseconds. Windows has a systematic lack of support for this kind of precision so I had to find other solutions, like using an atomic clock synchronizer. But even with that, the golden rule is: trying to keep the least number of machine involved in the data collection.

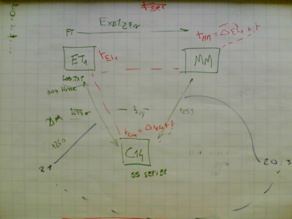
In my case I have three: two eye-trackers (windows) and a server which handles the messaging system (linux-box). After realizing that the clocks of the three machines have variables delays that change over time, I elaborated a strategy to re-sync the logs. It consists in watching the videos sampled on each eye-tracker at 15 frames per second and look for a specific event that appears almost at the same time in the two machines, like a message being posted on the server. Then I have a common event on the three machines that, besides network and processing delays, happened in the same ‘absolute’ moment. From there is just a question of doing the math.

Experiment Re-Synch

The silly thing is that is not possible to automate this algorithm with a script, so I had to watch all the movies for extracting the relevant info. It turned out that also doing the math was somehow brain consuming, so I ended up offloading progressively my cognitive charge in favor of a paper based grid.

Paper Grid Synchronization

Here some more about my experiment.

Tags: , ,

Mobile Processing: a mobile prototyping kit

Mobile Processing is an open source programming environment for people who want to design and prototype software for mobile phones. It is based on and shares the same design goals as the open source Processing project. Sketches programmed using Mobile Processing run on Java Powered mobile devices.

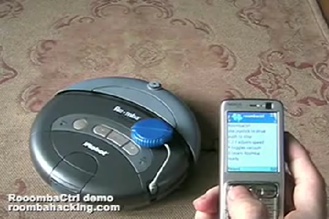
The example below shows an example of hack to drive a robot vacuum cleaner with the mobile phone.

Mobile Porcessing

Copyright notice: the present content was taken from the following URL, the copyrights are reserved by the respective author/s.

Tags: , , , ,

LIFT workshop report: redesigning the city of the future

Last Wednesday I participated to this workshop organized by Nicolas Nova and William Cockayne. The idea was to brainstorm for two hours using critical foresight techniques. But, what is critical foresight? The way Bill presented it, is an effort to brainstorm in a structured manner thinking about the long-term future.

Future is complex and ambiguous. The only way it is possible to say something about the future is by analyzing the past using analytical reasoning and understand when change happened. The point is then to project the same patterns found for a certain story ahead in the future so to find possibilities. Quoting Nicolas:

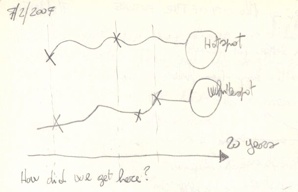
This is one of the crux element we have to tackle while doing critical foresight: unfolding the history backward from and end point to now, by describing what happened in the forms of changes/events. The lines here can be seen as a metaphor of two different histories that unfold.

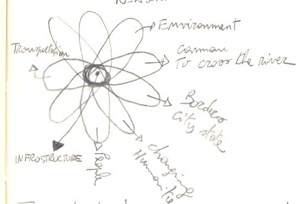
William presented a couple of techniques that can be used in these circumstances: the petal graph, is a diagram where you map each critical aspect of change that you can list while thinking to a certain theme. The goals is then to find the commonalities of all these aspect, what goes in the center of the flower.

Petal-Graph Foresight

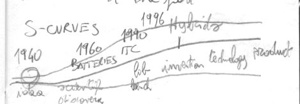
Another graph that we used was called the S-curve. It’s an s-shaped curve that has at the beginning the date a certain idea was invented and at the end of the curve the date where the corresponding technology finally reached mass market. In between all the different inventions and technologies that contributed to the raise of the curve. The goal is to understand what critical invention / moment constituted the turning point of the curve and made the realization of the idea possible.

S-Curve Foresight

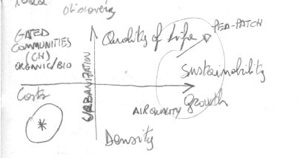
The last graph was a cartesian diagram where four different aspect of a certain theme needs to be opposed. Once the axes have been defined the brainstorm aims at finding stories and position these stories in the quadrants according to their match to the 4 defined dimensions. High-density spots are called hot-spots and the contrary are called white-spots. Both are extremely interesting for critical foresight.

Cartesian-Diagram Foresight

One defined these two areas we can then used a diachronic table to answer the question: how did we get here? The table, in fact, should map the most important momentums in the definition of a certain technology with the goal of projecting the line to touch the hot spots or the white spots. The time-scale of the graph is usually 20 years.

Diachronic Foresight

Foresight thinking for design encompasses three mayor steps:

(1) Observation: -think about people today; -if they change what is the reason?; -what are the early indicators (triggers)?

(2) Analyzing and describing: -ideas are fine; -questions are important; -assumptions are critical; -stories will tie it all together.

(3) Prototyping: -models are endpoints; -the models generate questions around the areas of interest; -the underlying assumptions and questions are more important.

The results of the workshop are less interesting than the methodology that we used to produce them.

Here is also a list of readings and movies that can inform more and inspire for critical foresight.

LIFT: Life, Ideas, Future, Together 2007

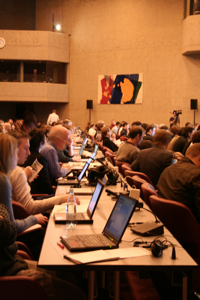
LIFT is a non-standard conference about the challenges and opportunities of technology in our society. It ran on the 7th, 8th, and 9th of February 2007 in Geneva, Switzerland. LIFT has a simple goal: connect people who are passionate about new applications of technology and propel their conversations into the broader world to improve life and work. This is my conference report, where I try to distill some implications which I find relevant. [Here my running notes if you want to get dirt: day1, day2]
Lift07

Nurturing a critical mind: we should encourage people to critically verify the information that they use in their life. Florence Devouard, of the wikimedia foundation, remembered us that one of the advantage of their ‘wiki-approach’ is that there are people all around the world which participate and that have access to local information that might be not available elsewhere. The key point is about empowering individuals.

Designing for open-endedness: we should design services where we let users free of inventing new opportunities. Sampo Karjalainen, one of the key persons behind habbo hotels, explained us his vision behind the success of habbo. The open ended game is the great innovation of habbo. They discovered the rise of use of the site using this kind of play but they did not anticipated. People like to play. How can we design for this kind of play? 1- You need something to play with, 2- The interface should be invisible / minimal, 3- The environment should be playful to set the stage for these activities, 4- Common games have a single goal. It is better to have multiple goals, 5- the social setting is important.

The individual is the center of the world: the most successful applications are these that do a good job in helping the users to express their passions, their interests. etc. Habbo is a great example of these sorts of things. Stowe Boyd explained us that Me should be in the center of each social application. The next level is the group of peers that are related to me and might interest/be interested by my interaction. Finally there should possibly be a market around me+my peers.

Shifting our business models to respect humanity: current business models stress corporate responsibility towards stockholders. ENRON is a perfect example of correct application of this principle that does not respect humanity. Paola Ghillani reminded us that exists alternatives. She mentioned the Norwegian central bank that decided not to invest in anu business that did not comply with self-imposed ethical guidelines.

Outdoctrination, or designing for self-organising learning: children can self-instruct in a connceted environment irrespective of their background, intelligence, race, etc. BUT they have to be in groups. Sugata Mitra reported on The hole in the wall: an experiment in Delhi. A PC embedded in the wall.  The experiment showed that technology is engaging and can overcome illiteracy. Children in groups can self-instruct themselves. Language was not a barrier.

Going virtual in proportion to being actual: the anonimity of the internet interaction must lead to a human encounter. Sister Judith Zoebelein reminded us that our task, as designers, is to make manifest the global community to the local community. All these simulated persons that we can be using Internet can bring confusion to who I really am. I will blog more deeply about this in the next days.

Bridging 1st life and 2nd life: 1st life is in the atoms’ world. Every digital bit owes its existence to the material world. 1st life maintains our 2nd life. This material basis undergrids the second life. That is a debt in materials, in human resources, of expended energy. Why it matters? It matters because there are critical externalities. 1st life doesn’t reboot when the system crashes. In 1st life you cannot install more servers. In our 2nd life worlds we have many avatars. In 1st life we have only one body. We only have only one world to inhabit. Julian Bleecker pushes us to create legible, playful reminders of the materiality of 1st life.

Making the locus of control visible: Everyware is an emergent paradigm from computation. Wiser’s notion of a computing “invisible, but in the woodwork everywhere around us.” Adam Greenfield rings the alarm bell of disappearing computer. Everywere obscure the locus of control. Everywere can be engaged even in the absence of an active, conscious decision to do so. We can be inadvertent: I didn’t mean to engage this system. I meant to do something else; unknowing: I did not know. I wasn’t aware of this existence; and worst we can be unwilling: I don’t want to be exposed to this system, but I have been compelled to accept such an exposure.

Avoiding Internet global warming: User-Generated content is a key topic nowadays. Jaewoong Lee stress out that we have to worry about global warming on the internet because the long tails is in fact just garbage. User Generated Content which is poorly constructed and that creates pollution in the search indexes without any utility. Maybe we need intelligent layers to aggregate content depending on the user needs. Maybe we need a community gardener, some people responsible to take care of the virtual side of the community.

Embracing the real world messiness: there is a vision in ubiquitous computing that everything needs to be seamless, that has to disappear, that needs to become calm. We see many examples of bad interaction design. The wold is messy. We rely on infrastructure but infrastructure can break down. Another aspect is heterogeneity: it very difficult to come out with standards. Fabien Girardin highlights how we are building a tower of babel of technologies that are often in competition. The point is to use a seamful design: revealing the “seams” (limits, boundaries, uncertainty). Know when to reveal or hide the imperfaction of the system.

Avoiding burning out while preserving ‘the flow’:  there are lots of examples of technological addition. what we see is that more and more there is an invasion of the private life in the work time. What we are seeing is that the social network is part of the daily activity. Maybe we should talk about social network dependance more that technological dependance. Stefana Broadbent is against the idea of umplugging. This conference is about social intelligence, which is the consequence of “the flow”.

The User/Citizen Centered Society: User Generated Content is now accepted in mainstreem media. The word of mouth is a great power. Everybody in this room has the ability to reach mainstream. Derek Powazek, founder of JPG magazine, shows how is possible to build a community generated magazine. JPG is the first truly community generated magazine. There is a huge community of writers that contribute to the articles and there is a huge community of voters which contributes to rate the content.

Thinking big, staying real: there are things that we need to reintroduce in our thinking: politics, power, borders, conflict. Fluid circulation of ideas is not going to stop this. Daniel Kaplan wraps up saying that we did not foresee the extintion of large corporations. Let’s remember ourselves that most of our information is now handled by huge corporations that have their own agenda.

Tags: ,

Tradenet: farmers using SMS to make business in Africa

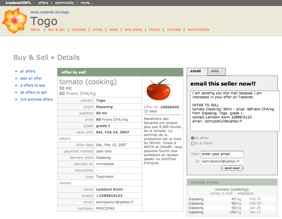
While doing my blogroll I was attracted by this news on Africans farmers using SMSs to make business. Tradenet, is a website developed in Ghana with an 11 million-dollar USAID support. It is intended to enhance trans-border trade between farmers and traders in Africa. The services are completely free for users, except the normal sms messaging charges by the mobile phone service providers of each country.

The site is  a platform for sellers in agricultural business to display their profiles and information on their commodities, prices and locations on the Internet, with the view to attracting potential buyers through the net. It also offers individuals and traders associations the opportunity to establish their own website within the tradenet platform at no cost to constantly display their commodities and prices.

“Potential buyers looking for a specific commodity only need to compose SMS message on their mobile phones stating the code of the commodity in question and the country from which they want the results and send it to tradenet number ‘1344’ for Areeba users or 024649999 from any other network and get instant results.”

Tradenet

Why SMS? This is a nice example of a service implementation that uses existing communication channels and infrastructure. The use of mobiles is pervasive and how explained by Jan Chipchase last week, the recent growth on the mobile market is coming from underdeveloped countries.

(via & via)

Copyright notice: the present content was taken from the following URL, the copyrights are reserved by the respective author/s.

Tags: , , , ,

Tellmewhere: a geo-wiki

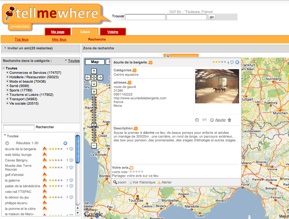
Gilles Barbier pointed me to his geo-localized application using Google Maps: Tellmewhere (dis moi ou). This site is basically a geo-wiki where everybody can describe collaboratively what they know on earth! They are currently focused on France, but they plan to  expand quickly after opening. This service is a sort of hyper-local site: they are going to add some social tools to help people of the same neighborhood to realize they share the same places.

I really likes the interaction. The reviews of the locations are quite detailed, it is possible to add pictures, and it allows social ratings on the posts. Really nice!

Tellmewhere

Tags: , ,

What can you do with Google Maps?

As part of my thesis I am trying to understand what are the things that people do with Google Map or with any other cartographic service. One of the way to answer this question is to look at new services/hacks/mash-ups that are developed around GM hoping that these will correlate with actual use. Here is a list that I put together.

  1. HousingMaps: Craigslist apartment listings plotted on Google Maps
  2. Found City: A community-generated map of interesting places in New York City
  3. Google Sightseeing: A blog that shows “the best tourist spots in the world via Google Maps’ satellite imagery.”
  4. Google-Traffic.com: Maps traffic data onto Google Maps
  5. Google Maps Wallpapers: Merges Google Maps satellite “tiles” to produce wallpaper or a poster
  6. Cheap Gas: Find cheap gas prices, powered by gasbuddy and Google Maps
  7. Entertainment locations listed on Lawrence.com are shown on mini-Google Maps inserted on the site’s pages
  8. Chicago transit maps on Google Maps
  9. ChicagoCrime.org. You can view crimes by type, location and a number of other criteria and see them plotted on a Google Map.
  10. Incidentlog.com – Real-time and historic archive of police, fire, and 911 incidents for many major U.S. cities
  11. A flight simulator which uses Google Maps
  12. Washington DC Metro Map
  13. New York City Subway Map
  14. New York City Subway Map – with lines and address search/plotting
  15. Boston MBTA Subway Map
  16. Gasbuddy and Google Maps for comparison shopping for gasoline
  17. Cytadia.com – Real estate ads geolocated on Google Maps (USA & Canada)
  18. Google Maps Pedometer – An application to measure distances traveled during a running or walking workout
  19. Los Angeles Earthquakes – Displays Earthquakes across Los Angeles (and the whole nation) with different icons representing different magnitudes
  20. Burbank Maps – Provides geospatial searching of news and realestate in Burbank, CA.
  21. Google Maps Route Planner – Place a number of points on a map, then ask to get a route with driving directions both written out and with a polyline on the map.
  22. GeoURL Mapper – GeoURL married to Google Maps. Demostrates how to use javascript RSS feeds to incorporate data onto google maps. Requires Firefox.

To resume there is a huge variety of hacks. The most common application consist in displaying fixed resources of the city like subway stations, or gas stations or things like that. Another sort of application requires to track variable features of the space like weather conditions or traffic etc. The only commercial application so far is the mapping of real estate.

We can also describe the above services in terms of the source of the geolocated information, which is given by some information providers. In other applications the source of the information are the people which contribute in the service. It is the case for Found City or SightSeeing. For a third category of these services the information is automatically bounded to specific coordinates using a gazetteer.

I think we are only seeing the tip of the iceberg of services using geolocalization. I share the enthusiasm of all the hackers out there imaging new services and use and I strongly believe that the killer app in this field must/will involve the community in the production of the information.

Tags: , , , , ,

Jan Chipchase at EPFL

Jan Chipchase gave a super interesting talk at EPFL on the Exploratory Field Study Reseach (thank Nicolas). The presentation was informal so we had a chance to interact a lot and to exchange ideas. Here are some random bits I annotated on my paper moleskine during the speech.

Jan works in a group that conducts field study to understand how people deal with technology in different cultures. Nokia uses these reports to inspire and inform new design.

Jan’s group uses different techniques to collect data. For instance, they use shadowing, following and taping people while using technology. They try to step in the customer’s shoes trying to act as if they were a Nokia costumer in different parts of the world. For instance they buy a phone, they break it and then they try to repair it in that particular location.

Another technique that they use are field questionnaires. For instance they go on the street and they ask a bunch of people structured questions on specific subjects (like: where would you put a phone?).

In Jan’s opinion diary methods do not work because the respondents restructure their assignments.

Jan’s group uses several methods on the same research subjects in such a way that the findings gets reinforced by, what he called, convergent validity.

He showed us a couple of examples of specific researches carried out by his group:

(1) Rural Charging Services in Uganda. How people stay powered up in regions where there are frequent powers cuts. People uses batteries to prevent cuts. This is an example of creativity that changes the way we (as citizens of rich countries) think about that problem.

(2) SENTE, is a nice example of how people deal with the lack of a distributed banking system in Uganda. Money are transferred as airtime from a person in a city to a relative in a village who owns a cell phone. If the person does not have a phone, phone kiosks are usually charged of exchanging airminutes with cash.

(3) Informal Repair Culture in Asia. Phones have different values in different markets. In Asia, for instance, it make sense to repair a mobile phone. There is a huge market of 2nd hand phones, repair instruction, material and centers.

What are the possible implications for design of such studies: for instance Motorola recently putted evident screws on their phones so to facilitate repair practices.

(4) Literacy, Communication & Design. Illiteracy can be found everywhere. Most of the growth in the phone industries is coming from underdeveloped countries.

The question is: to what extent is textual literacy a barrier to device literacy? How do illiterate people solve their daily tasks? Illiterate work for long hours and have a low flexibility. They can do anything (it just takes longer). Most tasks can be learned given the proper motivation.

Our willingness to explore is affected by our ability to recover from a possible failure which, in turn, is related to culture.