
Nicolas pointed me to this superb page containing a periodic table of visualization methods. The authors tried to define and compile existing visualization methods in order to develop a systematic overview based on the logic, look, and use of the periodic table of elements.
In this paper, they describe the current fragmented state of the visualization field. Then they outline the rules and criteria they applied in conducting their research in order to present a revised periodic table of 100 visualization methods with a proposition how to use it.
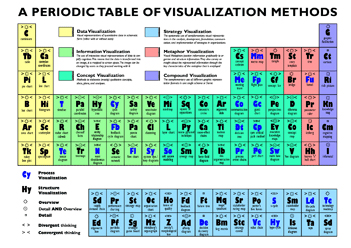
Interestingly, in the same page it is possible to see two nice visualizations on software visualization in engineering and visualization studies. Both are of high interest for the work I did at Microsoft Research this last summer. Here a working draft.
![]() Tags: information metric, information visualization, research, research methodology, reverse engineering, software visualization
Tags: information metric, information visualization, research, research methodology, reverse engineering, software visualization