
Very interesting discussion with colleagues who build direct democracy systems.

great names are like knots—they’re woven from the same stringy material as other words, but in their particular arrangement, they catch, become junctions to which new threads arrive, from which other threads depart
Jack Cheng, writer , June 2012
Great article by Jack Cheng on the Slow Web Movement. I particularly liked these quotes:
– And where the Fast Web is built around real-timedness, the Slow Web is built around timeliness.
– But timeliness alone doesn’t make something Slow Web. …Reliable rhythms lead to predictable outcomes, and rhythm is an expression of moderation.
– Fast Web is destination-based. Slow Web is interaction-based
– Behavior change, not growth. Behavior change is about improving the lives of others, scale is about ego. Getting scale after nailing behavior change is easier than nailing behavior change (and thus having a shot at durability) after hitting scale.
– Fast Web is about information. Slow Web is about knowledge.
– Timely not real-time. Rhythm not random. Moderation not excess. Knowledge not information.
I finally managed to find some time to do housekeeping on my blog …
Updated to wordpress 3.3.1 (http://wordpress.org). Looks nice and smooth.
My boss Nuria Oliver talks about MoviPill, a project that I worked on with Rodrigo de Oliveira in Telefonica Research during the last years. [PDF] The project aimed at improving medication compliance.
Bothin, A., and Clough, P. Participants’ personal note-taking in meetings and its value for automatic meeting summarisation. Information Technology and Management (December 2011), 1–19. [PDF]
—–
This paper reports the results of a quantitative study on how people take notes in meetings. The goal of the authors was that of aiding the design of innovative applications to support work-related meetings.
Notes taken during meetings have a pivotal role in helping people understand what happened during the meeting and to recall important information or decisions that were shared during the gathering. Taking notes is usually a tedious activity and therefore lots of scholar have focused on work-related meetings, trying to come up with automatic solutions to summarize what happened during the interactions.
The paper reports interesting references to studies that demonstrate a relation between acoustic features (i.e., pitch, intensity, speaking speed, and pauses) of the recordings of the meetings and annotations created by participants (Arons, 1994; Kennedy & Ellis, 2003).
Also, some possible implications in the design of systems to support annotations: shared note-taking was investigated by Landay & Davis, 1999 and by Wolf et al., 1992. Finally, the possibility to suggest notes to participant was examined by Banarjee & Rudnicky, 2009.
The paper describes interesting related work on how people take notes for personal reasons. These notes are created in daily life meetings regardless of whether specific instructions to create summaries are given to participants. Note-taking mainly takes place tin order to create a personal record to aid remembering what was being discussed. Participants in meetings usually take notes of the most informative events. They contain “personally important” points and details on action items assigned to the note-taker. Most relevant references for these findings are the studies of Khan, 1992; Whittaker et al., 2005; and Wittaker et al., 2008.
These studies point out that during work meetings only salient and personally interesting points are recorded. The notes people generally take are short (i.s., 20-30 s long on average) [Khan, 1992]. These notes are likely to have predictive power for finding the most important parts of meetings.
The same authors examined the role of of individual differences in talking and note-taking activities in meetings (Bothin & Clough, 2010). Participants had different behaviour according to their gender, age, and native language. Women wrote more but men talked more within meetings. The older the participants were, the more they talked and noted. Native English speakers wrote more, but there was no significant difference in talking behavior.
In their experiment, Bothin & Clough examined the AMI corpus, involving 104 participants in total, and found that personal notes were generally short. Single items were around 8 seconds long on average (SD 3). They found a positive correlation between the total meeting length and the total number of the notes (r = 0.21), as well as the total meeting length and the total duration of the notes (r = 0.20). Perhaps people prefer to write down key words only [Khan, 1992] and every time something important to them occurs in the discussion.
Geyer, W., Richter, H., and Abowd, G. D. Towards a smarter meeting record–capture and access of meetings revisited. Multimedia Tools Appl. 27 (December 2005), 393–410. [URL]
——-
This paper surveys and discusses various ways of indexing meeting records by categorizing existing approaches along multiple dimensions. The authors introduce the notion of creating indices based upon user interaction with domain-specific artifacts.
The paper contain a detailed literature review of previous studies of note taking behavior during and about meetings.
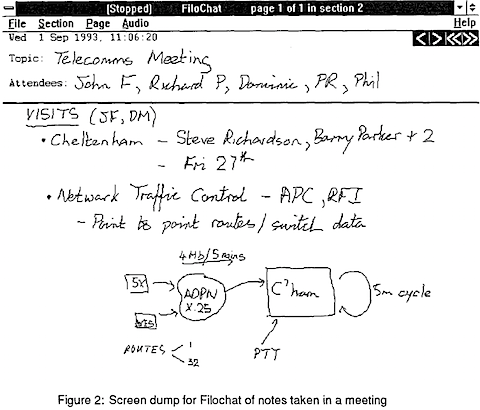
Whittaker, S., Hyland, P., and Wiley, M. Filochat: handwritten notes provide access to recorded conversations. In Proceedings of the SIGCHI conference on Human factors in computing systems: celebrating interdependence (New York, NY, USA, 1994), CHI ’94, ACM, pp. 271–277. [PDF]
——-
This paper presents a study of how people take notes in meetings. The authors interviewed people who used audio recordings in offices to identify the main benefits and barriers they experienced. Later, they interviewed 28 non-users of audio recording devices about the way they took notes during meetings.
They found a need for supplementing handwritten meeting notes with a verbatim speech record of the conversation. On the basis of this, they built a prototype system that combined co-indexed handwritten notes and recorded audio in a digital notebook. They discussed perceived benefits of this technology.
In their literature review, they discuss some “speech-as-data” applications, such as the Voicenotes (Stifelman et al., 1993) and the Ubiquitous audio (Hindus & Schmandt, 1992). These applications allowed the organization of brief segments of personal audio such as “ideas” or “reminders”.
An autoritative overview of Social computing and its relation to social media:
As humans we are fundamentally social creatures. For most people an ordinary day is filled with social interaction. We converse with our family and friends. We talk with our co-workers as we carry out our work. We engage in routine exchanges with familiar strangers at the bus stop and in the grocery store. This social interaction is not just talk: we make eye contact, nod our heads, wave our hands, and adjust our positions. Not only are we busy interacting, we are also remarkably sensitive to the behaviors of those around us. Our world is filled with social cues that provide grist for inferences, planning and action. We grow curious about a crowd that has gathered down the street. We decide not to stop at the store because the parking lot is jammed. We join in a standing ovation even though we didn’t enjoy the performance that much. Social interactions like these contribute to the meaning, interest and richness of our daily life.
More: interviews with Tom Erickson
Erickson, Thomas (2011): Social Computing. In: Soegaard, Mads and Dam, Rikke Friis (eds.). “Encyclopedia of Human-Computer Interaction”. Available online at http://www.interaction-design.org/encyclopedia/social_computing.html
Here are my notes of this year MobileHCI 2011. I presented the work we conducted last year on contextual applications with the UDSI team. The paper was titled: “Barriers and bridges in the adoption of mobile phone contextual services” – PDF: http://goo.gl/jgXlH, SLIDES: http://slidesha.re/oNAcVY.
MobileHCI 2011 has been organized in Stockholm, Sweden by the SICS and by the MobileLife center. I was in the organizing committee. I chaired the design competition. This year we had 420 registered participants. We received around 270 submissions out of which 63 papers were chosen for presentation at the conference (23% acceptance rate). Best paper award was given to a work of Niels Henze titled: “100,000,000 Taps: Analysis and Improvement of Touch Performance in the Large”.
The keynote was given by Jeanna Kimbré (Sony Ericsson). She started her talk with the premise that form (hardware design) should reinforce function (software design). In her line of thinking form should follow function + fun. Therefore they do lots of research on materials and colors to find the most appealing combination for what they call aesthetic expression (a combination of user experience and design). They follow the 6D (design, develop, distill, discard, delight). They publish every year a 250 pages trends report because they are a global organization and they need to be on the same page.
On the first day, I presented Karen’s paper in the session “Understanding mobile phone use”. Tricia Wang from UCSD presented the paper titled “Ethnography of the telephone: changing uses of communication technologu in village life”. The study was conducted in isolated villages of Guatemala. They conducted a focused field work on communication technology because in these villages usually adult males leave the country to find a job in the States and to send back the money to their family. Cell phone signal coverage is poor and even if there was they probably could not afford the fares. They use call shops called “caseta telefonica”, locutorios. These are important places to make and receive phone calls. People in the villages do not have private phones in their homes and therefore use the casetas. People are called through loudspeakers so everybody knows about the phone calls they receive. People in some villages now use a telefono fijo that is an hybrid embedding GSM technology. This kind of phones are used by a third of the families. These are typically shared by 4 families. Understanding how communication technologies are used in this places is important because these remote villages like this one exists everywhere in the world. We need to understand the social conditions that underly the use of technology. Implications: 1- cost of mobility -> for most people in the world mobility comes with a cost; 2- intermediate technology -> older technology comes back into intermediate ways.
MATTHIAS BOHMER presented a paper titled “Falling asleep with facebook Angry bidrs and kindly / a large/scale study on mobile application usage.” They tried to answer the question: How do people use their applications on mobile phones? Their work relates to the paper by girardello and michahellis, 2009 on Appaware. However, while this looks only at applications installed and disinstalled, they also look at how these applications are used. They developed an app sensor that was embedded within a recommender application for smartphone applications. APPAZAR. Basic findings: typical user uses an app for about one hour per day. They also have usage per category. App usage correlates with circadian circle. They showed a table of probabilities of applications being used in specific times of the day. They also looked at transitions between applications. Implications: 1- menus should adapt to time, location, previously used apps; 2- app design should incorporate apps transition patterns; 3- app sensor can provide additional context information.
HENRIETTE CRAMER presented a paper titled: “Performing a check/in: emerging practices, norms and conflicts in in location.sharing using foursquare”. They focused on applications such as foursquare that use a check-in model. Why does it work? There is a semantic naming of places. There is a gamification aspect because you can get points for checkins. They tried to understand foursquare usage motivations and norms. There are utilitarian reasons to check in. Also, for social-connection & self-presentation. To learn about new people and to discover new places. 17% of the participants of the study did not share their check-in with others. Why? For future reference, to get discounts, to self-motivational tool, and to pass time. Some people self-impose some rules such as actually visiting the place and not just passing by. The system does not impose this limitation. Some users only friends their inner circle. They say they would not want to friend strangers and colleagues and their bossed but they actually have this people in their friends list. People adapt to their audience. Some content is acceptable in one network but it is not acceptable on another network. Some users invent virtual places to make inner jokes such as checking into a bridge over the road where most people get stuck in morning traffic. The game element also affect the real world perception.
JAIME TEEVAN conducted an interesting study that is relevant to our work on Mobile Information Needs. The paper was titled: “Location, Time & People in Mobile Local Search”, They conducted a survey on mobile local search with 929 microsoft employee. They asked questions in what was the last local search they conducted on mobile decide. People search while they are on the go. People plan to visit the POI fairly soon and want the poi to be fairly close. 63% of searches were conducted with another person. 24% of reasons to begin search involved another person. About half of searches are for generic places. In addition to users’ current location the users’ destination is also important. People often use search results immediately.
MOHIT JAIN presented a paper titled: “Exploring display techniques for mobile collaborative learning in developing regions.” Many times it happens that multiple children interact in front of a single display. The paper review previous literature on this theme. They designed collaborative games that could be deployed in mobile devices for developing regions. They redesigned a collaborative version of boggle. In the experiment they compared a single display with pico projector with a multiple display on mobile devices.
RONALD ECKER from BMW research presented a paper titled: “EcoChallenge: a race for efficiency.” Their goal was to encourage the drivr to have a more eco-friendly driving style without patronizing him/her. They describe the designing a location based driving challenge. The driver bahavior can influence efficiency up to 50%. They designed a community based and in-car system that allow the users to compete in a challenge to maintain the most efficient driving style.
COSMIN MUNTEANU focused on adult literacy. He presented a paper titled: “Showing off your mobile device: Adult literacty learnung in the classroom and beyond.” Nearly 9 million Canadian adults are at low literacy levels (1 or 2). Literacy levels have not changed over the past decade. They studied eleven participants in two classes over six months. They designed a mobile application to improve reading skills for adults. They application offered also the possibility to understand the meaning of words. They referred to the TAM (technology acceptance model).
In the afternoon I took part in the context session where I presented our work on contextual applications. BRIAN LIM presented a nice work on the “Design of an Itelligible Mobile Context-Aware Applications”. They started from the premise that if users do not understand how application works they end up misusing or abandoning them. The work he is focusing on is how to make applications intelligible. How to design an intelligible context-aware application for mobile social-awareness. They designed LAKSA a prototype they designed to answer this question and to test previous findings. They describe 4 design strategies for intelligibility. They run usability studies to test these 4 strategies.
JOEL FISHER presented a paper titled: “Investigating Episodes of Mobile phone Activitys indicators of opportune moments to deliver notifications.” They tried to use contextual information to find when was the best time to show a notification on a mobile phone. They tried to model breakpoints in cognitive tasks. Opportune moments for delivery lay at the breakpoints between subtasks. They designed an experiment to test the hypothesis. They designed an application on the android to popup the question related to the interruption.
Later, I attended a session on navigation and wayfinding. STEFANO BURIGAT presented a paper titled: ¨Pedestrian Navigation with Degraded GPS Signal: Investigating the Effects of Visualizing Position Uncertainty¨. The basic question they tried to answer was: “How can we support navigation when the GPS signal is degraded or not available?”. Their solution was to make the position uncertainty explicit, visualizing an estimate of the area where the user might be located. The area of uncertainty is centered on the last accurate position. They compute the size of the area of uncertainty base on the motion of the user. They display the area of uncertainty as a circular area or as a colored street network. They conducted an evaluation where they simulated a degrated GPS signal and presented the users with one of the visualization (either circular or street network). They found that street visualization required a smaller workload (NASA TLX) than the basic visualization.
The first session of Thursday afternoon was on text entry technology. PER OLA KRISTENSSON presented a paper titled: “A Versatile dataset for text entry evaluation based on genuine email”. Text entry methods were usually based on methods that asked people to type predefined sentences. Experiments should be reproducible. They propose to use the EXXON dataset. Many emails in this corpus have been marked as sent by a blackberry. From this corpus they extracted 2239 sentences or fragments. They manually reviewed them and fixed spelling mistakes and removed duplicate sentences or incomprehensible sentences. They compared this corpus with other datasets obtained through desktop pcs and found that emails written on a mobile devices are different because contains less letters, they are written in 1st person, and they contain questions. The impications is that we should use this corpus to test text entry on mobile devices.
http://keithv.com/software/enronmobile/
SAURABH PANJWANI presented the paper: “Script-Agnostic Reflow of Text in Document Images”. Sometimes evectronic documents are available to users only in the form of document images (PDF bitmap). Screen width can hinder readability of text. With document images the user is forced to pan and scroll. Reflow tools exists but these works largely for english documents only. They rely on ocr (optical character recognition). Less than 15% of the wold speaks English natively. Increasingly books in such scripts are being digitized. Therefore they tried to answer the following question: “Can we build tools that can reflow non-english text without using OCR?” They designed a script-agnostic reflow for PDF documents and demonstrated the tool during the talk. Their method works for scripts that separate words by white spaces. They evaluated the technique with 4 languages: english, hindm hannadam and arabic.
KIMBERLY WEAVER presented an interesting paper titled: “Understanding information preview in email email processing”. The goal is to undertand the tradeoff between information preview in emails and workload. They asked participants had to triage their work email on a personal iphone. They were using their actual emails not corpus. They asked participant to repeat the task for a week. Each day they were using a different number of preview lines. The recorded the logs and they administered a questionnaire each day. From a log side they found that 3 lines are optimal, while use choice was on 2 lines.
YOUNGHEE JUNG presented an interesting paper titled: “Solving the Indian Text Input Puzzle”. In India there are 22 official languages in Constitution. 77 M English literate (< 10%) People in India they are not using their own language on mobile phones because these script languages are not supported on these phones. They aimed at designing a text input mechanisms that could minimize the learning curve and that could support all 22 languages. They designed the new input technology and this reduced dramatically the keypresses when compared to Panini and the Nokia ITU keypad.@JABBERER HTTP://YOUNGHEE.COM
The very same problem was tackled by ANIRUDHA JOSHI who presented a paper titled: “Devanagaru virtual keyboards for touchscreens mobile phones.” They designed a virtual keyboard that grouped vowels and consonants and that mapped them on the keyboard by frequency of use. Also, they applied a color code. They produced several designs and compared them.
JEFF PIERCE presented a paper titled: “Smart Phone use by non-mobile business users”. Mobile phones to produce information not just consuming information. People do less input of the information than consumption of the information. Device password and device limitations push people away from using mobile devices for their work. They did not observe any difference in terms of using a virtual vs. physical keyboard. People normally overestimate reading time, while they underestimate typing time. People normally think that doing tasks on mobile phones takes more time and effort. One of the implication of this work is that perhaps we can separate personal and business use through some sandboxing and ‘personas’ for devices.
Later I attended a session on the collaborative production of video. AUDUBON DOUGHERTHY presented a paper titled: “Live Streaming Mobile Video: Productions as civic engagement”. She works for the Comparative media study department, MIT. Their research question was the following: What kind of videos are actually being broadcast online through mobile devices. They studied Qik which is a smartphone app to broadcast video from the mobile. They assigned value tags to the videos found on the website to understand production trends. Thgey interviewed some of the top producers of videos in Qik. 11% of the video had personal values while the rest being personal videos. Civic videos were largerly generalistic. Users were largerly male. The average length of videos wer 7 minutes and 30 seconds while civic videos were 5 minutes longer in average. Sharing ideas with strangers was enough of a motivating factor to push users of Qik to produce their videos.
http://amd4.net
HELI VAATAJA presented a work titled: “Crowdsourced news reporting: supporting news content creations with mobile phones.” They focused on a hyperlocal community news. This is a local newspaper where readers send 20K pictures every year. At the moment, the journalists of the newspaper choose stories and then send MMS to volunteers/readers so that s/he can write a short article about the story and add some pictures on it. The best story that appears in the tabloid receive a prize. They are now looking at solutions to geolocate their readers to be able to assign them to stories that are also diverse in terms of coverage of the territory. They conducted a study with 9 participants. Most of them had stubmitted photos 2-3 times in last half a year. Their main motivation to participate was the incentive given. They conducted a study on SMS + location based assignments. They found several benefits for reporters and for the news room.
The final keynote was delivered by Adrian Cheok (university of Singapore and KEIO JP). His main argument was that we should move from informational communication to experiental communication. He showed a number of prototypes on experiental communication. E.g., giving hugs to your pet friends, hugging people at a distance, enriching paper communication. He showed examples of communication involving food printing. He also presented example related to sound and smell communication.
CHI 2011 was held in Vancouver, CA on May 7-11 [1]. For those who do not know CHI, this is the premiere conference on human-computer interaction. This year there were over 3K attendees. The conference had over 6.9K authors that submitted 2.5K articles. Of these, 20% were accepted for presentation in the conference. The event had 16 tracks running in parallel with over 150 presentations every day. The keynote was delivered by Howard Rheingold (Smart Mob): it was about learning.
I attended the first three days of the conference and –as always– there were many papers that got my attention. What you are going to read next are some notes I took of papers that I found interesting. Particularly, I attended sessions on the following topics: research methods (mostly qualitative), telepresence, tagging, low-cost ICT for development, microblogging, user studies in developing regions, wireless networks, home automation, HCI for peace, location sharing, and low-cost phones.
On the first day, I attended a session on research methods, that got three honorable mentions. Of these I liked the presentation of Eric Baumer (Cornell) who conducted a study to compare activity theory and distributed cognition. His argument was that depending on the theory that you choose as researcher you can get results that are dramatically different. To prove the point, they conducted a fake study that was analyzed using both the AC theory and the DC theory. They discussed several points that help researchers choose the right research method. The other presentation I liked was that of Jens Riegelsberger and Audrey Yang (Google) who reported on methodological issues they identified while conducting field research across 9 locations. There were several things that worked well such as in-field pre analysis, cloud tools and templates used by the various teams to share data, and card-sorting at the basecamp. However, there were several things that did not work well, such as safety margins for logistics that were too short, and work load of field teams that was set too high. On the same session, Leah Findlater (HCIL, U Maryland) presented the Aligned Rank Transform for non-parametric Factorial Analysis [2]. Basically, error rates and user satisfactions are often measured with ordinal scales. Also, Error rates are often skewed towards zero and therefore we cannot analyze the data using a factorial ANOVA. The method they presented, called ART retain familiarity with the f-test and allow to conduct factorial analysis using ANOVA procedures on these situations. Unfortunately, they did not present the math behind, need to look at the paper.
In the afternoon, I attended the Designing for Democracy session. The first presentation did not fully fit in this session because it was about persuasive technology to promote ideal weight. It was presented by Victoria Schwanda (Cornell). They presented a system called Fit4Life that used sensor to monitor all the user was doing and to even listen to his conversations with the aim of persuading him/her to have a more active lifestyle. The system is NOT real. The created this design to provoke discussion on the limit that this kind of technology should have. The second presentation was delivered by Joan di Micco (IBM research), about how to engage citizens through visualizations of congressional legislation. She proposed 4 stages of engagement with government data: a. understanding, b. communication, c. interpretation, d. contribution. Their system was dealing with the first level. They used MALLET, a machine classifier to assign each part of a bill to a certain topic. They conducted analysis of usage patterns of power users vs. casual users. They also interviewed many of the casual users. Later, Moira Burke (CMU) presented Social Capital on Facebook, a longitudinal study on social capital based on kinds of facebook activities and individual differences. They run longitudinal surveys paired with facebook server logs. To measure casual relations between the variables they used a lagged dependent variable analysis. They found that lots of direct communication is associated with well-being. So, for social capital it is not enough to have friends in network. Benefits, come from interacting one-to-one with them. Similar findings were presented by Christian Yoder (U North Carolina). They found that status updates were not associated with an increase of social capital. This is mostly because these updates were not “talking” to anybody in particular.
Later on the same day, I attended the “tagging” session. One of the most interesting presentation was delivered by Michael Bernstein (MIT) who talked about “friendsourcing”. The whole concept was extremely related to the Social Tagging Revamped paper that we presented last year. Their basic premise was that some applications need specific information about you and can perform vey interesting forms of personalization. He described in particular Collabio, a facebook game that allows participants to tag each other with keywords that describe their interests and preferences. Using this information they could propel a number of services that are better tailored to people’s needs. He also listed a number of commercial services that were designed using the “social crowdsourcing” premise: GuessWho, FeedMe, Social Q&A (a specialized version of Quora), and Socialpedia. All in all, it was interesting to see that our idea of crowdsourcing is taking place and being incorporated into several commercial products. Michael has posted the paper and the slides of the presentation on his website [3].
On Tuesday, I attended the low-cost ICT for development session. Elba del Carmen (U Duisburg-Essen) and colleagues conducted surveys and field studies to understand how children appropriated the presence of mobile phones in rural classrooms in Panama. They lent the phones to the students for the duration of the study. Ruy Cervantes (U California Irvine) presented a study of how mexican schools used low-cost laptops. Their findings showed that the ecological infrastructure is key to support laptop-based education. Technology coordinators were extremely important to bring teachers up to speed and to administer the sharing of the resources. A strong human infrastructure was key to support change. Next, Gaurav Paruthi (MSR India) presented a study on how DVD players can be used as offline browsers for wikipedia. Their basic premise was that DVD players penetration rate was higher than PC penetration rate in India. Therefore they designed a distribution of wikipedia for DVD [4]. The menu and search could be done through the remote control of the television. They believe this is the cheapest way of distributing multimedia content in developing regions.
In the afternoon, I attended the session on microblogging behavior. Kate Starbird (U Colorado) presented a paper titled: “Voluntweeters: Self-Organizing by Digital Volunteers”. The released a microsyntax for twitter to help during the emergency situations. They studied how people used twitter during the quake in Haiti last year. Volunteers were retweeting, tweeting ushahidi reports, verifying information and putting people in contact with local coordinators. Volunteers did not know each other before the quake. Therefore they studied the emergence of the organization. Cathy Marshall (MSR) presented a study of people’s perception of ownership of user generated content. Who owns the tweets? What are the limits that people feel about media they did and did not create themselves? For many people is perfectly fine to take online content and re-use it for personal presentations and communications. Haewoon Kwak (KAIST) presented a study on the reasons why people unfollow others in social networks. Studying this kind of behavior is hard because social networks do not expose this kind of behavior. Therefore they scraped a dataset of 1.2M users in Korea and collected daily snapshots of follow networks and compared consecutive structures of this network. They found that people unfollow frequently in twitter, 43% of the time during the subsequent 2 months after following a peer, with an average 15 unfollow per person. The study reported a number of reasons for unfollowing a peer. A similar study was conducted by Funda Kivran-Swaine (Rutgers U) who focused on the impact of network structure on breaking ties in online social networks. They tried to understand what structural properties of the social network of nodes can predict the breaking up of ties in twitter. They used a huge dataset that was analyzed with multi-logistic regression. The model is reported in the paper. The more neighbors a dyad shared the less likely the breaking of the relationship. They also found that follow-back rate in twitter is a good indication of status in the SN.
Less related to this last group was the study presented by Jennifer Golback (U Maryland) on computing political preference among twitter followers. They used a list of congress members that are active on facebook. They also used a secondary source of information to understand how much liberal or conservative they are. They also intersect this information with news on online news sites. They found that people tend to follow politicians whose ideas reflect theirs. They are thinking about using this system to create a recommender system. They can use the same method to rate companies with their environmental score.
In the afternoon, I attended a session on user studies / ethnography in developing regions. Indrani Medhi (MSR India) presented a study on designing mobile interfaces for novice and low-literacy users. Deepti Kumar (IIT Madras) presented a study on how mobile payments are handled in India. The study focused on how people bargain and negotiate prices. Elisa Oreglia ( U California Irvine) describes information-sharing practices and ICT use in rural northern China. They found an abundance of information, and a scarce localization. There is an abundance of ict but under-utilization. They found a prevalence or oral information exchanges. Also, they found that information brockers are extremely important.
One last paper in the afternoon caught my attention. Barry Brown (U California San Diego) presented an interesting study on challenges and opportunities for field trial methods. The paper discusses methodological challenges in running user trials. They constructed a fake trial to examine how trial insights are dependent on the practices of investigators and participants. The best quote: “participants do not like your system, they like you!”.
On Wednesday, I attended the wireless networks session. Marshini Chetty (Georgia Tech) presented a paper on making network speeds visible. They designed Kermit a prototype [5], who visualize who is online, to allow personalization of the display, show the biggest bandwidth user, and show a history of bandwidth usage to make correlations. Participants in their interview showed that they had little understanding of what bandwidth is. They also showed to have little knowledge of how internet applications use bandwith. The tool seemed to help understanding who was consuming the internet in the household. Kermit also allowed them to control network usage in ways that participants were not used to.
[1] http://www.chi2011.org/
[2] http://faculty.washington.edu/leahkf/pubs/CHI2011-wobbrock-AlignedRankTransform.pdf
[3] http://people.csail.mit.edu/msbernst/
[4] http://www.wikipediaondvd.com/site.php
[5] http://www.ic.gatech.edu/news/kermit-helps-households-monitor-and-manage-their-internet-speed