This Friday, I have been playing with some visualizations for my current experiment. The main point is to understand the sequence of actions between the two players trying to organize a concert on distance using a shared map and a chat application. My objective was to show the sequence of actions that brought the pair to reach a certain solution. In the concert experiment I organized there are three types of events: utterances, icon movements, and evaluations of score. Also the activity is not constrained in any way so that the player are free to any of these events at any point in time.
(1) The first goal of my visualization was to show the parallelism of actions between the two players: where there any concurrent actions happening in a micro sequence of the task?
(2) The second point was to show action fragmentations: how many icon movements were performed during the same sequence of interaction?
(3) The third point was to show participants cognitive alignment, superimposing to this information eye-movements registered using the eye-trackers, to answer questions of the kind: do participant B looked at A’s message before performing his/her subsequent actions?
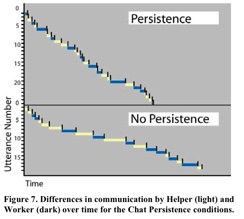
Somehow I was trying to combine Gergle et al. [1] visualization techniques. He used a timeline display to show parallelism ad a time-series to show the sequence of actions in his experiment of a pair in a collaborative problem solving (see the pictures below).
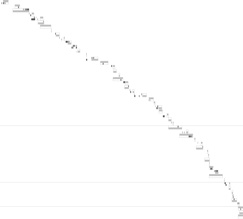
Somehow I was trying to combine these two techniques in a comprehensive visualization. So, I came out with an initial prototype which answer the first two points above. Each line in the series represent a sequence of interaction between the two participants the upper part is reserved to participant A, while the lower part is for participant B. light gray shows the time of composition of a message, while dark gray shows the movements of the icons. Horizontal lines show the score evaluations that were launched during the game. The horizontal axis of the graph represents time (the experiment lasted 45 minutes). The vertical axis starts on the top-left corner and it represents the utterances produced during the interaction.
Reference
[1] D. Gergle, D. R. Millen, R. E. Kraut, and S. R. Fussell. Persistance matters: Making the most of chat in tightly-coupled work. In Proceeding of CHI2004, pages 431–438, Vienna, Austria, April 24-29 2004. ACM Press. [url]
![]() Tags: Computer Supported Collaborative Work, context, controlled experiments, eye-tracking, human computer interaction, information visualization, research, research methodology
Tags: Computer Supported Collaborative Work, context, controlled experiments, eye-tracking, human computer interaction, information visualization, research, research methodology


